
In today’s lesson, we made a Gantt chart to make time managing easier for our fantasy projects.
A Gantt chart is a type of bar chart that Picturises a project schedule which was made by Henry Gantt, who designed the chart around 1910–1915. Modern Gantt charts also show the dependency relationships between activities and the current schedule status.
Gantt charts convey this information visually. They outline all of the tasks involved in a project, and their order, shown against a timescale. This gives you an instant overview of a project, its associated tasks, and when they need to be finished.
An example of a Gantt Chart:
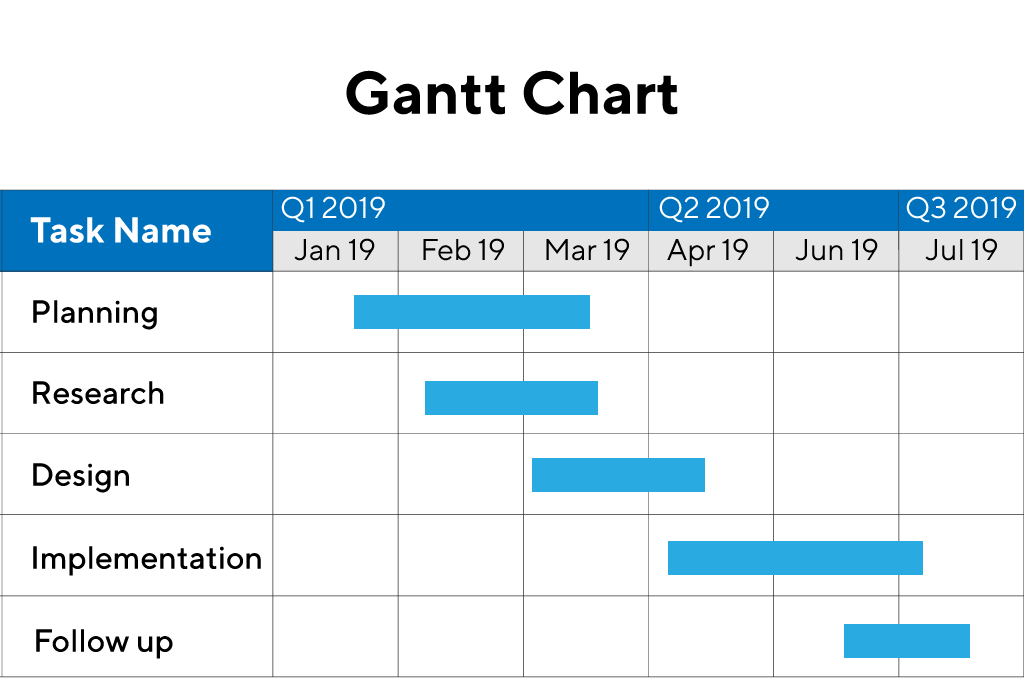
One column has the dates and the other has the task names. Each bar is a different length which shows how long a task should take to complete and when to start a task.
I made a Gantt chart to help manage my time for my brief. For the first week, I’m going to do planning and finalising ideas so I can start them next week. Next week, I will get started on my animation as it will take some time to make. The week after, I will start working on my poster. The week after that, I will continue work on the animation. On the final week, It would be industry week and I wont have much time to do my work. So this week would be finishing off anything that needs finishing before the deadline.

In the future for my next brief, I will also make a Gantt Chart to help me keep on track and make sure I complete my brief on time. It is good to have a reference and something to look at so you know where you are with the brief.