what is a gantt chart?
A gantt chart is a kind of chart similar to a bar chart. It lists all of the stages of production for a project, and orders them chronologically to form a plan of which stages are to be completed at a certain time.
For example, the production of a project cannot start before the pre-production stage has been completed.
structure of a gantt chart
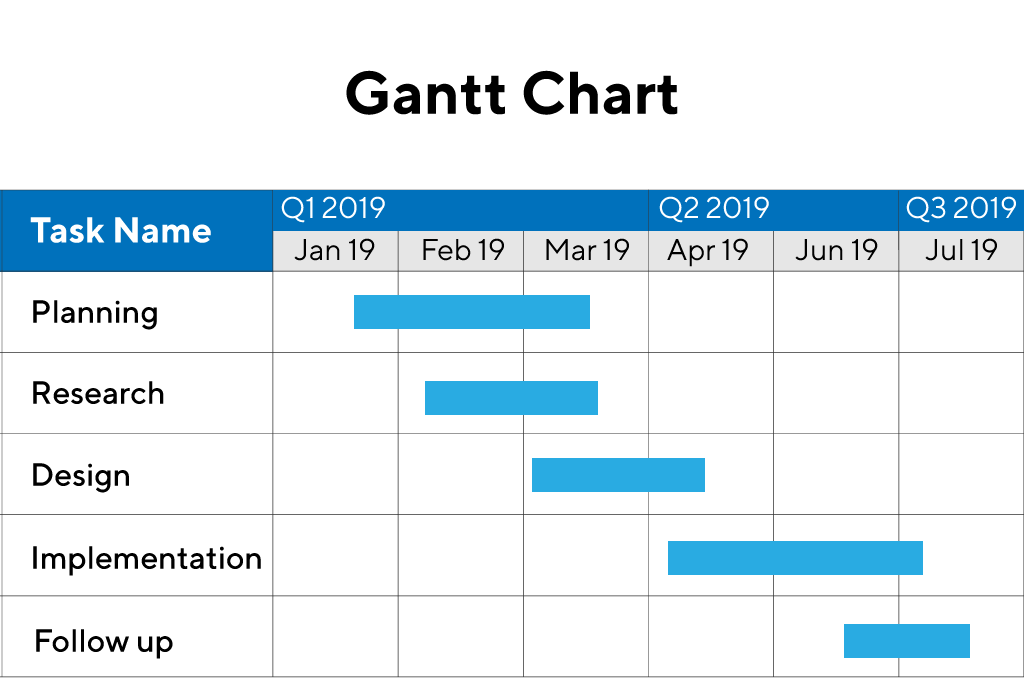
Outstanding tasks are listed in the leftmost column. The tasks that need to be completed first are at the top of the column, with the later tasks at the bottom.
The chosen time scale is broken down into a row of columns that run from left to right at the top of the chart. Therefore, each cell represents a specified amount of time (day, week, month) that is allocated to completing a certain task.
why are gantt charts used?
Helps to structure projects.
If you are working for a client, it shows the client that their work is being completed in a professional and organise manner – it lets them know that the person they have hired for the job is reliable.
It is also helpful for teachers, and bosses to see your progress on the project.
It gives you a place to start on the project by breaking down and organising the tasks to see which ones need completing before others.
Here is the link to my gantt chart i created to show the pre production process.